# Tracing Asynchronous Messaging with OpenTelemetry in Go
Table of Contents
In the previous post, we illuminated the “dark matter” of our microservices: the database layer. We saw how a simple SQL query could be the bottleneck in our request pipeline and how the N+1 problem manifests visually in a trace.
But modern distributed systems rarely stop at just HTTP and SQL. To build resilient, decoupled systems, we often turn to asynchronous messaging using tools like RabbitMQ, Kafka, or SQS.
In our OrderFlow demo app, we have a common pattern:
- A user places an order (HTTP).
- The
Ordersservice persists the transaction to the database. - It then fires off an
order.createdevent to Kafka. - The
Workerservice consumes that event and triggers a confirmation email.
Without instrumentation, our trace stops dead after step 2. The Orders
service fires the event, but we don’t see it in the trace, and we have no idea
what is happening after. The Worker picks it up, but as far as Jaeger is
concerned, that’s a completely new, unrelated trace.
Today, we’re going to bridge that gap. We’ll learn how to propagate OpenTelemetry context across the asynchronous boundary of a message queue, creating a single, unbroken trace from the user’s click to the final email delivery.
The Challenge: Context Propagation
In HTTP, context propagation is standardized. We use the traceparent header
to pass the TraceID and SpanID from one service to another. Libraries like
otelhttp handle this automatically.
Kafka doesn’t have a built-in “traceparent” standard that everyone agrees on, but it does support message headers. Our job is to:
- Inject the trace context into the Kafka headers when producing a message.
- Extract the trace context from the Kafka headers when consuming a message.
If you want to follow along, clone the repo and checkout the starting branch:
git clone https://github.com/joao-fontenele/orderflow-otel-demo.gitcd orderflow-otel-demogit checkout 02-database-instrumentationOr jump straight to 03-messaging-instrumentation to see the final code.
Step 1: The Carrier
OpenTelemetry has an interface called TextMapCarrier that abstracts the
mechanism of storage. It essentially says: “I don’t care if you are an HTTP
header, a gRPC metadata, or a carrier pigeon; just give me a way to Get,
Set, and list Keys.”
The kafka-go library we’re using stores headers as a slice of structs, which
doesn’t automatically fit that interface. So, we need to write a simple
adapter.
Create internal/messaging/carrier.go:
package messaging
import "github.com/segmentio/kafka-go"
type MessageCarrier struct {  msg *kafka.Message}
func NewMessageCarrier(msg *kafka.Message) *MessageCarrier {  return &MessageCarrier{msg: msg}}
// Get retrieves the value for a given key.func (c *MessageCarrier) Get(key string) string {  for _, h := range c.msg.Headers {    if h.Key == key {      return string(h.Value)    }  }  return ""}
// Set stores a key-value pair.func (c *MessageCarrier) Set(key, value string) {  // If the key exists, update it  for i, h := range c.msg.Headers {    if h.Key == key {      c.msg.Headers[i].Value = []byte(value)      return    }  }  // Otherwise, append it  c.msg.Headers = append(c.msg.Headers, kafka.Header{    Key:   key,    Value: []byte(value),  })}
func (c *MessageCarrier) Keys() []string {  keys := make([]string, len(c.msg.Headers))  for i, h := range c.msg.Headers {    keys[i] = h.Key  }  return keys}
This tiny struct is the Rosetta Stone that allows the OpenTelemetry propagator to talk to Kafka messages.
Step 2: Instrumenting the Producer
When we publish a message, we want to start a span to track the “send” operation. More importantly, we want to inject the context of that span into the message so the consumer knows where it came from.
In internal/messaging/producer.go:
func (p *Producer) Publish(ctx context.Context, key string, event any) error {    // ... marshaling code ...
    msg := kafka.Message{        Key:   []byte(key),        Value: data,    }
    // 1. Start a PRODUCER span    ctx, span := producerTracer.Start(ctx, "send "+p.topic,        trace.WithSpanKind(trace.SpanKindProducer),        trace.WithAttributes(            semconv.MessagingSystemKafka,            semconv.MessagingOperationName("send"),            semconv.MessagingOperationTypePublish,            semconv.MessagingDestinationName(p.topic),            semconv.MessagingKafkaMessageKey(key),        ),    )    defer span.End()
    // 2. Inject the context into the message headers using our Carrier    otel.GetTextMapPropagator().Inject(ctx, NewMessageCarrier(&msg))
    // 3. Send the message    if err := p.writer.WriteMessages(ctx, msg); err != nil {        span.RecordError(err)        span.SetStatus(codes.Error, err.Error())        return err    }
    return nil}
Notice trace.SpanKindProducer. This tells Jaeger that this span is sending a
message, which helps it draw those nice directional arrows in the UI.
Step 3: Instrumenting the Consumer
On the receiving end, the logic is reversed. We pull the message off the wire,
wrap it in our MessageCarrier, and ask the propagator to Extract any
trace context hidden in the headers.
If it finds a context, our new “process” span becomes a child of the original “send” span. If not, it just starts a new root trace.
In internal/messaging/consumer.go:
func (c *Consumer) processMessage(ctx context.Context, msg kafka.Message, handler func(ctx context.Context, payload []byte) error) error {    // 1. Extract context from headers    parentCtx := otel.GetTextMapPropagator().Extract(ctx, NewMessageCarrier(&msg))
    // 2. Start a CONSUMER span using the extracted parent context    spanCtx, span := consumerTracer.Start(parentCtx, "process "+c.topic,        trace.WithSpanKind(trace.SpanKindConsumer),        trace.WithAttributes(            semconv.MessagingSystemKafka,            semconv.MessagingOperationName("process"),            semconv.MessagingOperationTypeDeliver,            semconv.MessagingDestinationName(c.topic),            semconv.MessagingKafkaConsumerGroup(c.groupID),            semconv.MessagingKafkaMessageOffset(int(msg.Offset)),        ),    )    defer span.End()
    // 3. Call the actual business logic handler with the new span context    if err := handler(spanCtx, msg.Value); err != nil {        span.RecordError(err)        span.SetStatus(codes.Error, err.Error())        return err    }
    return nil}
Step 4: The Worker’s Outbound Calls
We’re almost there. The Worker service receives the message (now
instrumented), but it then needs to make HTTP calls to the Email and
Inventory services.
For the trace to continue flowing out of the worker, we need to ensure its HTTP client is also instrumented.
In cmd/worker/main.go:
  // Initialize the TracerProvider for the worker  shutdownTracer, err := telemetry.InitTracerProvider(ctx, "worker", "0.1.0")    // ...
    // Use otelhttp to wrap the HTTP client  httpClient := &http.Client{    Timeout:   10 * time.Second,    Transport: otelhttp.NewTransport(http.DefaultTransport),  }
  notificationHandler := worker.NewNotificationHandler(..., httpClient, logger)
Because we passed spanCtx (which contains the trace ID from Kafka) into our
handler in Step 3, and because our handler uses this context when making
HTTP requests with httpClient, the propagation chain continues!
The Result: A Unified Trace
Let’s fire it up.
make all-upto start the stack../scripts/generate-traffic.shto create an order.
Open Jaeger. You will no longer see disjointed traces. Instead, you get this masterpiece:
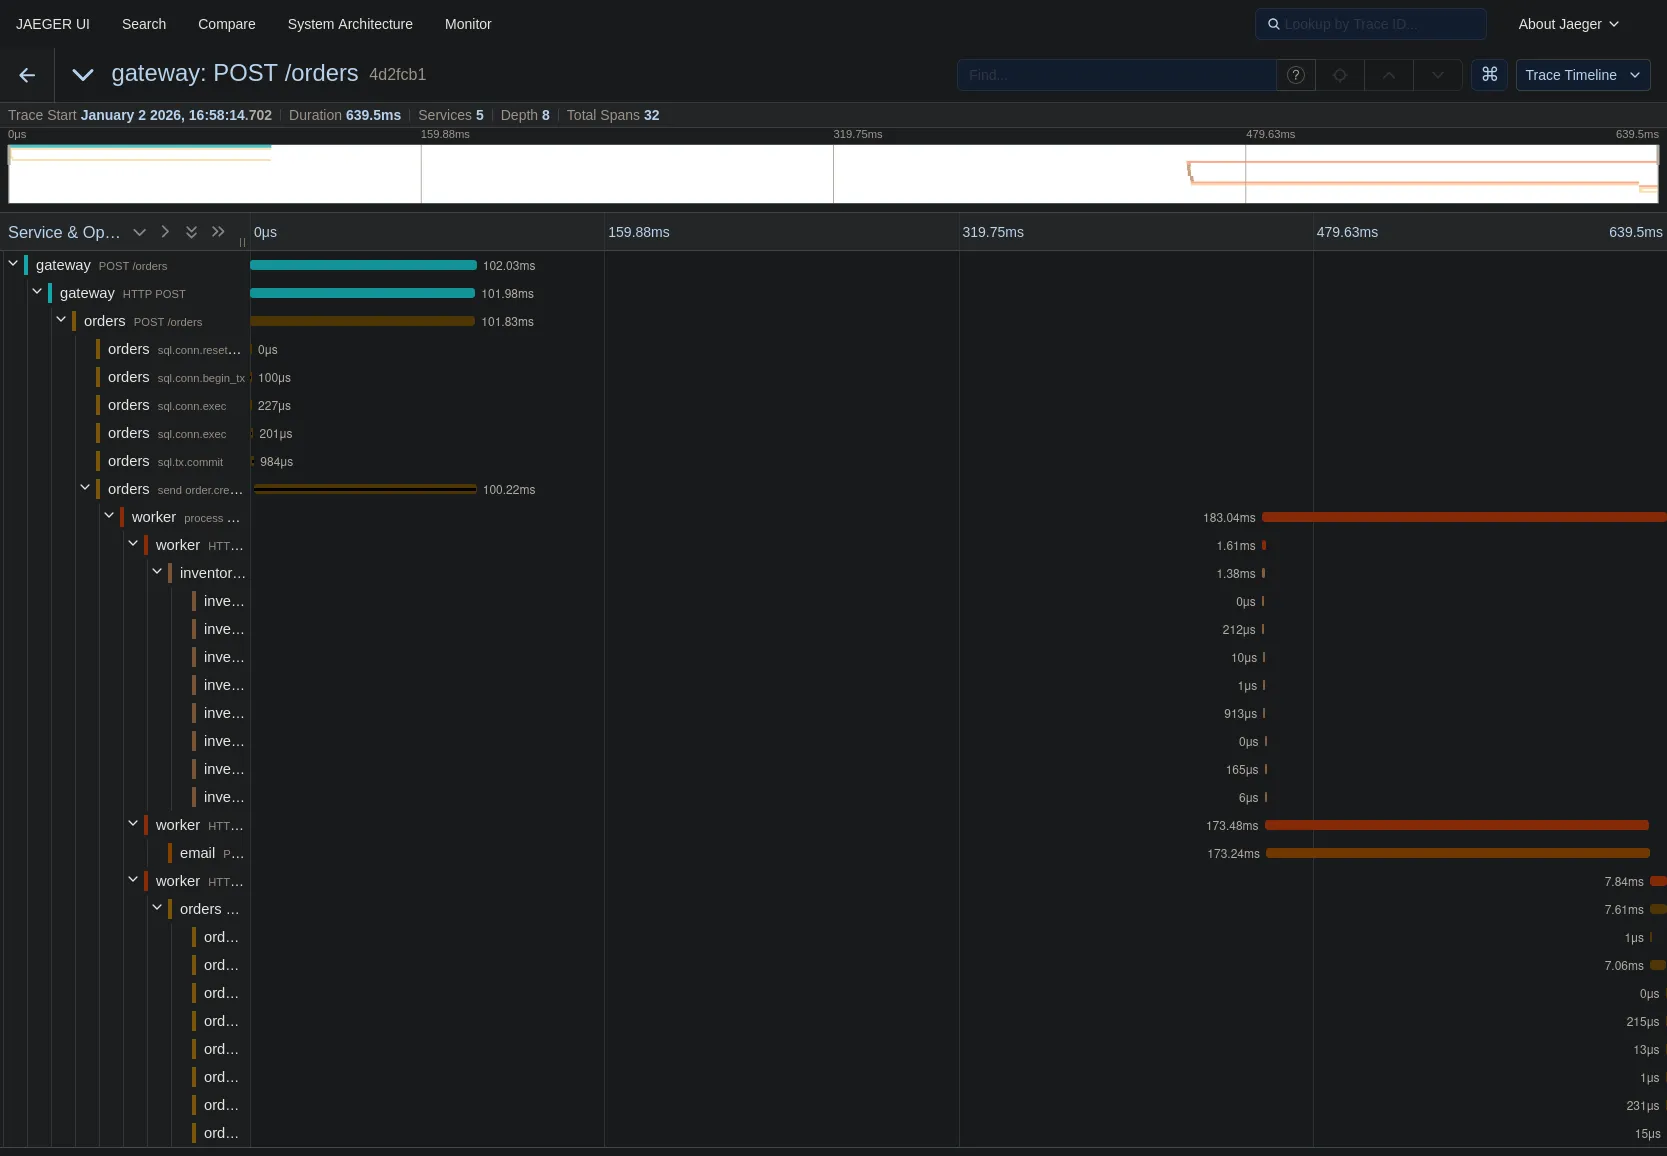
Let’s trace the path:
- Gateway receives the POST request.
- Orders service processes it and commits to the DB (that cluster of yellow spans on the left).
- Orders service
sends order.created(the brown span). - Worker service
processes order.created(the long orange span starting in the middle). - Worker calls Inventory and Email services (the spans on the right).
The gap in the middle? That’s the time the message sat in the Kafka topic waiting to be picked up. We can now visualize queue latency!
Wrapping Up
We have now instrumented the three main pillars of backend communication:
- Synchronous HTTP (Service to Service)
- Database SQL (Service to Data)
- Asynchronous Messaging (Service to Queue to Service)
We have full observability. If a user complains “I didn’t get my order confirmation email,” you can find the trace for their order ID and see exactly where it failed—was the Gateway slow? Did the DB lock up? Did the Worker crash? Or did the Email service return a 500?
It’s all there, in one single view.
In the next part of this series, we’ll look at how to leverage all this data we’re collecting to build metrics and dashboards, turning our individual traces into high-level system insights.
