
# Instrumenting Go HTTP Services: A Hands-On Guide to OpenTelemetry
Table of Contents
We’ve covered the theory and the why. Now it’s time to write some code.
In this post, we’re going to take a vanilla Go microservices application (completely blind to the outside world) and give it eyes. We’ll instrument both the HTTP server (handling incoming requests) and the HTTP client (making outgoing requests) using OpenTelemetry.
By the end of this, you’ll be able to fire a request at your API Gateway and watch a trace propagate through your services in Jaeger.
Our demo app: OrderFlow
For this series, I’ve built a reference application called OrderFlow. It’s a simple e-commerce toy simulation with three services:
- Gateway: The entry point.
- Orders: Manages order creation and retrieval.
- Inventory: Tracks stock levels.
Right now, it’s a black box. If the Gateway calls Orders and it times out,
we have no idea why.
If you want to follow along, clone the repo and checkout the starting branch:
git clone https://github.com/joao-fontenele/orderflow-otel-demo.gitcd orderflow-otel-demogit checkout 00-uninstrumentedStep 1: Install Dependencies
First, we need to invite the OpenTelemetry family to the party. We need the core SDK, the OTLP exporter (to send data to Jaeger), and the specific HTTP instrumentation library.
Run this in your project root:
go get go.opentelemetry.io/otel \ go.opentelemetry.io/otel/sdk \ go.opentelemetry.io/otel/trace \ go.opentelemetry.io/otel/exporters/otlp/otlptrace/otlptracegrpc \ go.opentelemetry.io/contrib/instrumentation/net/http/otelhttpotel/sdk: The implementation of the OpenTelemetry API.otlptracegrpc: The exporter that sends traces to the OpenTelemetry Collector (or directly to Jaeger) using gRPC.otelhttp: A “contrib” package that provides middleware fornet/http.otel/trace: The Tracing API.
Step 2: Setting up the TracerProvider
Before we can create spans, we need to initialize the TracerProvider. This is the engine that manages the sampling configuration, resources, and exporters.
I like to put this boilerplate in a shared internal package so all services can
reuse it. Create internal/telemetry/provider.go:
package telemetry
import (  "context"  "net/http"  "os"
  "go.opentelemetry.io/otel"  "go.opentelemetry.io/otel/exporters/otlp/otlptrace/otlptracegrpc"  "go.opentelemetry.io/otel/propagation"  "go.opentelemetry.io/otel/sdk/resource"  "go.opentelemetry.io/otel/sdk/trace"  semconv "go.opentelemetry.io/otel/semconv/v1.26.0"  oteltrace "go.opentelemetry.io/otel/trace")
func InitTracerProvider(ctx context.Context, serviceName, serviceVersion string) (func(context.Context) error, error) {  // 1. Configure the Exporter  // We'll use OTLP gRPC. By default it connects to localhost:4317.  // We use WithInsecure() because we're running locally without TLS.  endpoint := os.Getenv("OTEL_EXPORTER_OTLP_ENDPOINT")  if endpoint == "" {    endpoint = "localhost:4317"  }
  exporter, err := otlptracegrpc.New(ctx,    otlptracegrpc.WithEndpoint(endpoint),    otlptracegrpc.WithInsecure(),  )  if err != nil {    return nil, err  }
  // 2. Configure the Resource  // This identifies YOUR service in the traces.  res := resource.NewWithAttributes(    semconv.SchemaURL,    semconv.ServiceName(serviceName),    semconv.ServiceVersion(serviceVersion),  )
  // 3. Create the TracerProvider  tp := trace.NewTracerProvider(    trace.WithBatcher(exporter),    trace.WithResource(res),  )
  // 4. Set Globals  // This is important! It allows the library to access the provider  // and the propagator without us passing it explicitly everywhere.  otel.SetTracerProvider(tp)
  // The propagator handles the W3C Trace Context headers (traceparent)  otel.SetTextMapPropagator(propagation.NewCompositeTextMapPropagator(    propagation.TraceContext{},    propagation.Baggage{},  ))
  // Return a shutdown function so we can flush traces when the app exits  return tp.Shutdown, nil}
// WithHTTPRoute wraps an http.HandlerFunc to add the http.route attribute// to the current span using the request's Pattern.// This works around otelhttp not adding the route attribute after routing.func WithHTTPRoute(h http.HandlerFunc) http.HandlerFunc {  return func(w http.ResponseWriter, r *http.Request) {    if r.Pattern != "" {      span := oteltrace.SpanFromContext(r.Context())      span.SetAttributes(semconv.HTTPRoute(r.Pattern))    }    h(w, r)  }}
There are a few key things happening here:
- Exporter: We tell the SDK where to send the data.
localhost:4317is the standard OTLP gRPC port. - Resource: We define who we are. If you don’t set a
service.name, your traces will look like they came from “unknown_service”. - Propagator: We register the
TraceContextpropagator globally. This ensures that when we inject/extract headers, we use the standard W3C format we discussed in the previous post. - Route Helper: We added
WithHTTPRouteto manually set thehttp.routeattribute (e.g.,/orders/{id}) on the span. This is crucial for aggregating metrics by route later.
Step 3: Instrumenting the Server
Now let’s modify our Gateway service to use this. Open cmd/gateway/main.go.
First, initialize the provider at the very start of main:
func main() {  ctx := context.Background()  logger := slog.New(slog.NewJSONHandler(os.Stdout, nil))
  // Initialize OpenTelemetry  shutdownTracer, err := telemetry.InitTracerProvider(ctx, "gateway", "0.1.0")  if err != nil {    logger.Error("failed to initialize tracer", "error", err)    os.Exit(1)  }  // Ensure we flush remaining traces on exit  defer func() { _ = shutdownTracer(ctx) }()
    // ... rest of config loading ...
Next, we wrap our HTTP handler. The otelhttp package provides a wrapper that
automatically extracts the trace context from incoming headers and starts a new
span.
  // ... (mux setup) ...  mux := http.NewServeMux()  // Use Go 1.22 routing patterns and our helper  mux.HandleFunc("GET /orders", telemetry.WithHTTPRoute(handler.HandleOrders))  mux.HandleFunc("GET /orders/{id}", telemetry.WithHTTPRoute(handler.HandleOrders))  // ...
  // Wrap the mux with otelhttp and a custom span name formatter  otelHandler := otelhttp.NewHandler(mux, "gateway",    otelhttp.WithSpanNameFormatter(func(_ string, r *http.Request) string {      if r.Pattern != "" {        return r.Pattern      }      return r.Method + " " + r.URL.Path    }),  )
  server := &http.Server{    Addr:         ":" + port,    Handler:      otelHandler, // Use the wrapped handler    // ...  }
That’s it for the server side! Any request hitting this server will now start a
span named after the route (e.g., GET /orders/{id}), and include the
http.route attribute.
Step 4: Instrumenting the Client
The Gateway needs to call the Orders service. If we just use
http.DefaultClient, the trace context won’t be propagated. The “waterfall”
will break, and we’ll see two disconnected traces.
We need to instrument the http.Client so it knows how to inject the
traceparent header.
  // Create an instrumented HTTP client  httpClient := &http.Client{    Timeout:   10 * time.Second,    // otelhttp.NewTransport wraps the default transport    Transport: otelhttp.NewTransport(http.DefaultTransport),  }
// Pass this client to your proxies/services ordersProxy := gateway.NewServiceProxy(ordersServiceURL, httpClient)// Inside your proxy/handlerreq, err := http.NewRequestWithContext(ctx, "GET", url, nil)client.Do(req)If you use http.Get() (which doesn’t take context), the tracer won’t know
which active span to attach to the outgoing request, and propagation will fail.
Seeing It In Action
Let’s verify this works. I’ve included a docker-compose.otel.yml in the repo
that spins up Jaeger.
- Start the infrastructure:
Terminal window make all-up - Generate some traffic with
./scripts/generate-traffic.sh - Make a request (copy the UUID from one of the ‘create order’ logs in the previous step):
Terminal window curl http://localhost:8080/orders/:id - Open Jaeger at http://localhost:16686
You should see something like this:
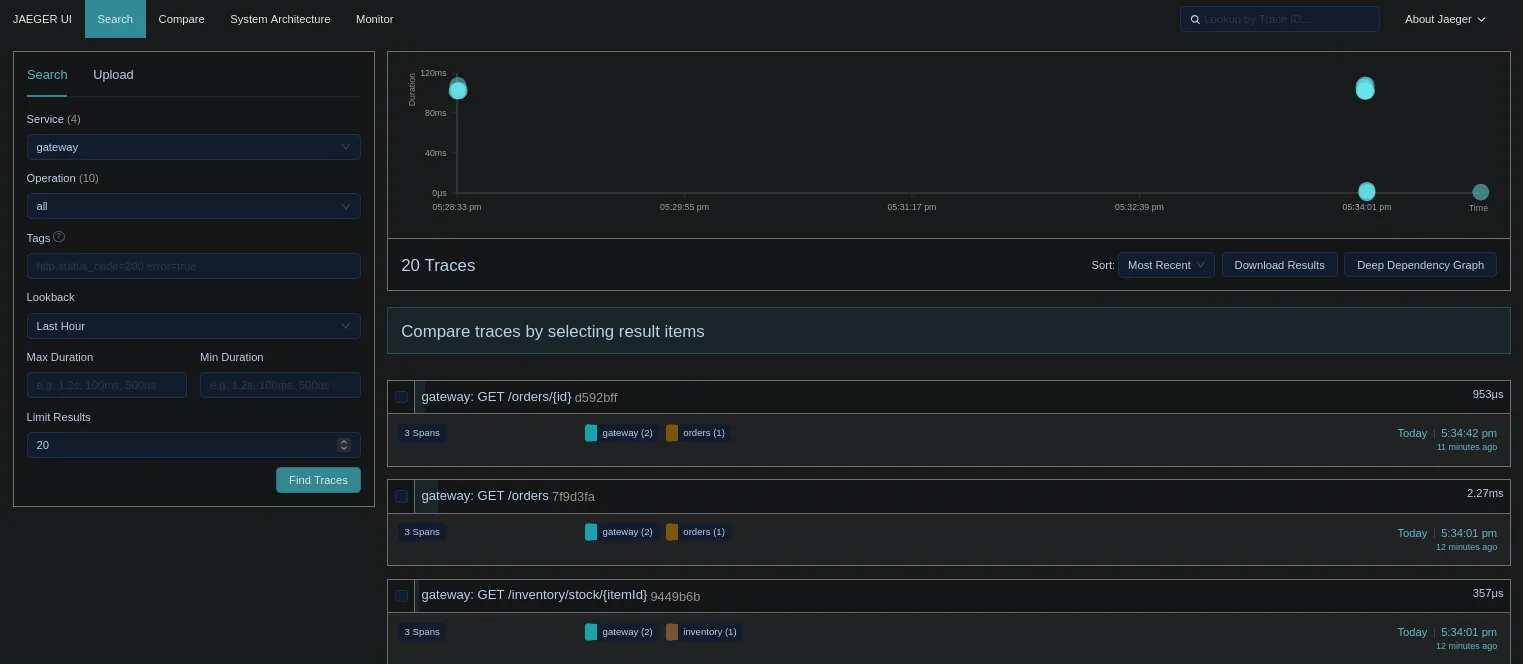 (Note: You’ll see the traces yourself when you run it!)
Select the most recent trace. It should represent our request to get order details.
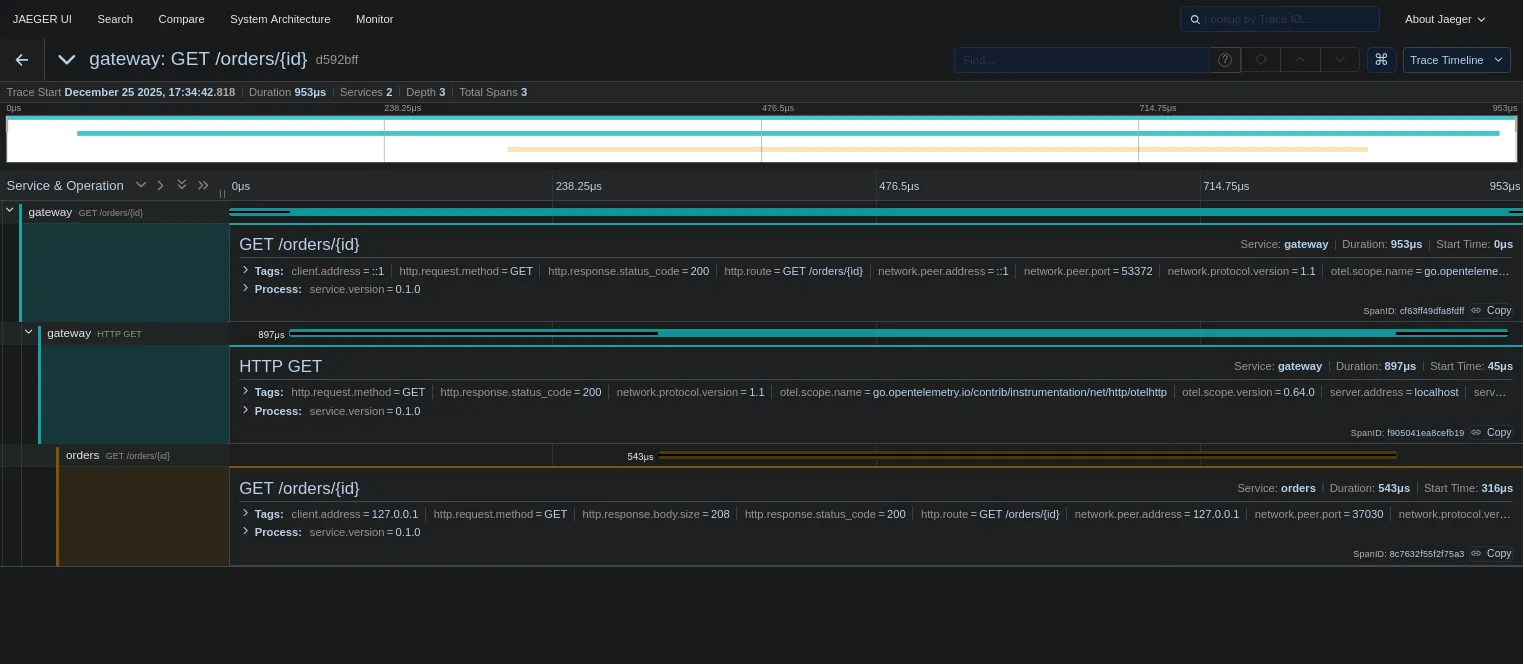
Take a close look at the timeline. See that small gap between the bars? That’s network latency. See how the bars cascade from top to bottom? That visualizes the sequential processing of our request. We can literally see time passing as our code executes.
Wait, where are the database calls? Where is the Kafka message?
We haven’t instrumented them yet! Right now, we only see the HTTP boundaries:
- Gateway received request (Server Span)
- Gateway called Orders (Client Span)
- Orders received request (Server Span)
The black boxes are getting smaller, but they are still there. In the next post, we’ll crack open those database transactions and see exactly what’s happening inside our services.
