# Debugging Distributed Systems at 2 AM
Table of Contents
It’s 2 AM. You receive a bunch of pages. “Service degradation detected. P50 latency up 300%”, “5XX error rate crossed threshold”, “Order queue consumer lag is critical”, the list goes on. You stumble to your laptop, wishing you’d slept better the night before.
You check your Grafana dashboard showing a spike in error rates on your main
client facing API. Next, you check logs and find: timeout connecting to downstream service. You have 47 instances across 7 services. Which one broke?
Why? Good luck.
This is the reality of distributed systems without observability.
Monitoring vs Observability
These terms get used interchangeably, but they’re not the same thing.
Monitoring answers predefined questions: Is CPU above 80%? Is the error rate above 1%? Is the disk full? You set up dashboards for metrics you think matter, and alerts fire when thresholds are breached.
Observability lets you ask questions you didn’t anticipate. Why did this specific request take 3 seconds when it usually takes 50ms? What’s different about the users hitting errors versus those who aren’t? Which service in this 10-hop request chain introduced the latency?
Monitoring tells you something is wrong. Observability helps you figure out the reasons.
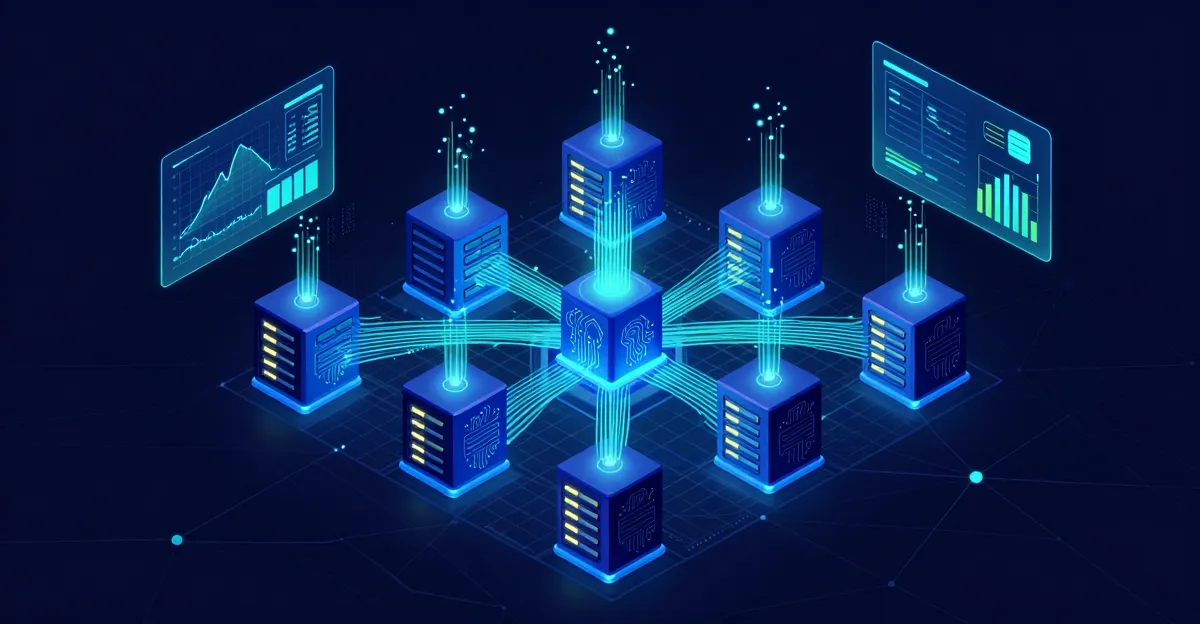
Distributed systems failure modes can combine and create symptoms that you’ve never seen before. You can’t possibly predict every failure mode across dozens of services, databases, caches, and message queues. You need tools that let you explore your system’s behavior after the fact.
The Three Pillars
Observability comes down to three signal types: traces, metrics, and logs. Each has strengths. Together they paint the full picture.
Traces
A trace follows a request through your entire system. When a user hits your API gateway, that request might touch an auth service, a user service, a database, a cache, and a notification queue before returning. A trace captures all of it as connected spans.
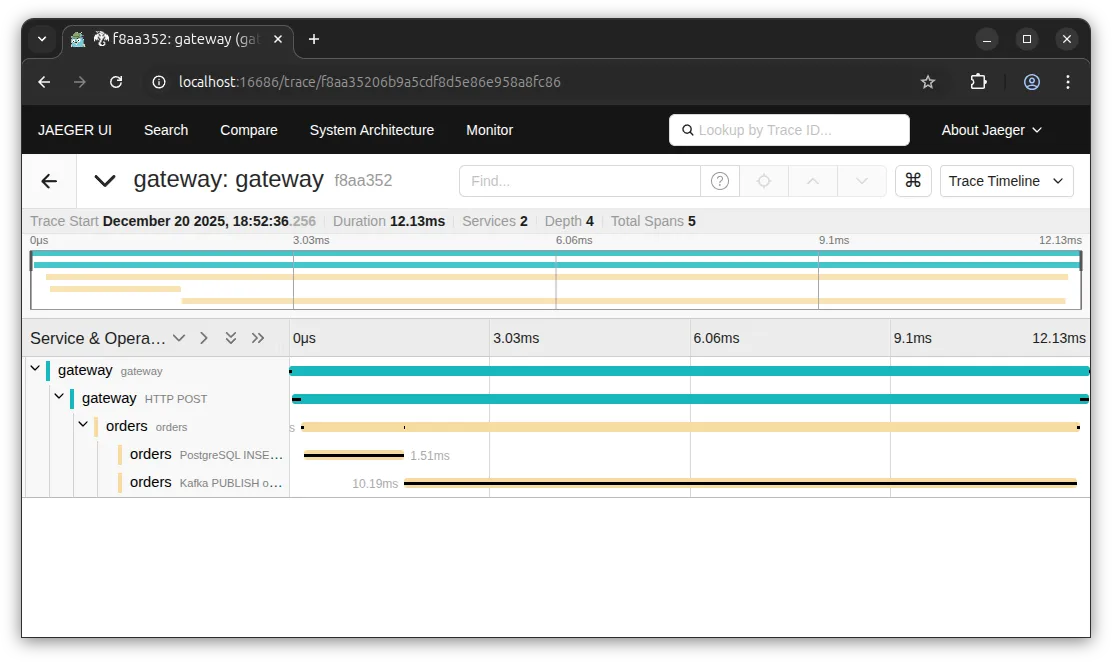
You can see exactly where time is spent. That 95ms in the Auth Service? The database query took 45ms, and there’s another 30ms calling Inventory. Now you know what to optimize.
Traces answer: “What happened to this specific request?”
Metrics
Metrics are aggregated measurements over time: request count, error rate, latency percentiles, queue depth, memory usage. They’re cheap to collect and store, making them ideal for dashboards and alerts.
The Google SRE Book famously defines the “Four Golden Signals” of monitoring: Latency, Traffic, Errors, and Saturation. In practice, we split these into two frameworks depending on what we are measuring.
For request-driven services, we use the RED method (a subset of the golden signals focusing on user experience):
- Rate (Traffic): Requests per second
- Errors: Failed requests per second
- Duration (Latency): Latency distribution (p50, p95, p99)
For infrastructure resources (CPU, memory, disk, network), the USE method applies (focusing heavily on that fourth signal, Saturation):
- Utilization: Percentage of time the resource is busy
- Saturation: Extra work the resource can’t service yet (queue depth)
- Errors: Count of error events
Metrics answer: “How is my system behaving right now? How does it compare to the past?”
Logs
Logs are timestamped records of events. A user logged in. A payment failed. A cache key was evicted. They’re the narrative of what your system did.
Logs are great, until you have too many of them. Grepping through terabytes of text is nobody’s idea of a good time.
High-traffic services generate millions of log lines. Finding the relevant ones is like searching for a needle in a haystack, especially if your logs aren’t structured. This is where traces help: they give you the specific IDs to filter that chaos down to the few lines that actually matter.
Logs answer: “What events occurred?”
Why do I need all three?
Each pillar has gaps that the others fill.
Metrics tell you there’s a latency spike, but not which requests are affected. Traces show you a slow request, but not how common the problem is. Logs explain what happened, but finding the right logs without a trace ID is painful.
When your trace includes a trace ID, and your logs include that same ID, and your metrics link to example traces via exemplars, you can jump between them. Alert fires on high p99 latency. Click through to an example trace. See the slow database query. Click to the logs for that query. Find the full SQL statement. Debug time: minutes instead of hours.
OpenTelemetry
Before OpenTelemetry, every vendor had their own instrumentation libraries. Datadog, New Relic, Jaeger, Zipkin, all with different APIs. Switching vendors meant rewriting instrumentation code. Adding a second backend meant double instrumentation.
OpenTelemetry is the CNCF project that fixes this. It provides:
- Vendor-neutral APIs for traces, metrics, and logs
- Language SDKs for Go, Java, Python, JavaScript, and more
- Automatic instrumentation for common libraries and frameworks
- A collector that receives, processes, and exports telemetry data
You instrument once with OpenTelemetry. Then you send data wherever you want: Jaeger, Prometheus, Grafana Tempo, Datadog, Honeycomb, or all of them at once. Switch vendors without touching application code.
The ecosystem has reached wide adoption. Major cloud providers support it. Most popular frameworks have OpenTelemetry integrations. It’s the obvious choice for new projects and increasingly worth migrating to for existing ones.
What This Series Covers
This series takes you from zero observability to instrumented Go services, so that when the next 2 AM page hits, you’ll know where to look.
We’ll build a sample microservices app called OrderFlow and progressively add instrumentation across several posts. Each hands-on post builds on the previous one. You’ll have local running code at each hands-on.
Next Up
The next post covers tracing fundamentals: what spans are, how context propagates across service boundaries, and the semantic conventions that make traces useful. We’ll get into the theory before we start writing code.
If you’ve ever stared at logs from 47 instances wondering which one caused the outage, and sworn you’d fix it “someday”, that someday starts now.
