# Tracing Database Queries with OpenTelemetry in Go
Table of Contents
In the previous post, we got our first taste of distributed tracing. We instrumented our HTTP server and client, allowing us to see requests flow from our Gateway to the Orders service.
But if you looked closely at those traces, you might have noticed something missing.
We saw the total duration of the request to the Orders service, but we had no idea what it was doing during that time. Was it writing to a database? Calculating pi? Sleeping?
Today, we’re going to turn the lights on in the data layer. We’ll instrument
our database/sql driver to automatically generate spans for every query,
allowing us to see the SQL statements, execution time, and even the number of
rows affected—all right there in our traces.
The Goal
By the end of this post, we’ll be able to:
- See every SQL query as a child span in Jaeger.
- Identify performance killers like N+1 query patterns visually.
- Understand the “waterfall” of latency in our services.
If you want to follow along, grab the repo and checkout the starting point:
git clone https://github.com/joao-fontenele/orderflow-otel-demo.gitcd orderflow-otel-demogit checkout 01-http-instrumentationThe final code for this post is available in the 02-database-instrumentation
tag.
Step 1: Install Dependencies
Go’s standard library database/sql is powerful, but it doesn’t support
tracing out of the box. To get visibility, we need a wrapper.
There are a few options out there, but I’ve had great success with
otelsql. It wraps the standard database
driver and automatically creates spans for Query, Exec, and even
transactions.
Let’s add it to our project:
go get github.com/XSAM/otelsqlStep 2: Create a Database Helper
Just like we did with the TracerProvider, I prefer to wrap this setup in a
helper function. This keeps our main.go clean and ensures we apply consistent
configuration across all our microservices.
Open internal/telemetry/database.go and add the following:
package telemetry
import (  "database/sql"
  "github.com/XSAM/otelsql"  semconv "go.opentelemetry.io/otel/semconv/v1.26.0")
func OpenDB(driverName, dsn string) (*sql.DB, error) {  // otelsql.Open wraps the driver and returns a standard *sql.DB  return otelsql.Open(driverName, dsn,    otelsql.WithAttributes(semconv.DBSystemPostgreSQL),  )}
What’s happening here?
otelsql.Open: This is a drop-in replacement forsql.Open. It returns the exact same*sql.DBtype, so you don’t need to change any of your repository code.semconv.DBSystemPostgreSQL: We explicitly tag our spans with the database system. This is useful for backends that can aggregate metrics by DB type.
A Note on Semantic Conventions
OpenTelemetry is evolving fast. To ensure we use the stable database semantic conventions, we need to opt-in via an environment variable.
In your docker-compose.services.yml, add this to your services:
environment: - OTEL_SEMCONV_STABILITY_OPT_IN=database # ... other varsThis ensures our traces use the standardized db.system, db.statement, etc.,
attributes that Jaeger expects. If you don’t set this variable, the
instrumentation will default to emitting older, duplicate, or deprecated
attribute names to maintain backward compatibility. You can read more about the
schema transformation logic in the OpenTelemetry Go
documentation.
Step 3: Wire It Up
Now, let’s switch over to cmd/orders/main.go. We need to replace the standard
connection logic with our new instrumented helper.
Before:
// Old way (standard lib)db, err := sql.Open("postgres", postgresURL)After:
// New way (instrumented)db, err := telemetry.OpenDB("postgres", postgresURL)That’s literally it. Because otelsql returns a standard *sql.DB interface,
the rest of your application, your repositories, your transaction logic, your
domain code, doesn’t even know it’s being watched.
Here is the full context in cmd/orders/main.go:
// ... imports
func main() {    // ... tracer init ...
  postgresURL := os.Getenv("POSTGRES_URL")  // ... check for empty url ...
    // Use our wrapper instead of sql.Open  db, err := telemetry.OpenDB("postgres", postgresURL)  if err != nil {    logger.Error("failed to open database", "error", err)    os.Exit(1)  }  defer func() { _ = db.Close() }()
    // Verify connection  if err := db.Ping(); err != nil {    logger.Error("failed to connect to database", "error", err)    os.Exit(1)  }
// ... create repo and start server}Visualizing the Data
To demonstrate the power of this visibility, I’ve added two endpoints to our Orders service:
GET /orders: Fetches orders and their items efficiently.GET /orders-nplus1: Intentionally fetches orders inefficiently to demonstrate the N+1 problem.
Let’s fire up the stack and generate some data.
make all-up./scripts/generate-traffic.shThe “N+1” Problem
The N+1 problem happens when code fetches a list of parent records (1 query) and then iterates over them to fetch child records for each one (N queries). In code, it looks innocent:
// 1. Fetch all ordersrows, _ := r.db.QueryContext(ctx, "SELECT ... FROM orders ...")
for rows.Next() {    // ... scan order ...
    // 2. BAD: Querying items inside the loop!    itemRows, _ := r.db.QueryContext(ctx, "SELECT ... FROM order_items WHERE order_id = $1", order.ID)    // ...}
This pattern destroys performance because of network latency. Even if each database query takes only 1ms, doing it 1,000 times sequentially means your user waits for a full second just for round-trips, before any real work is done. It puts unnecessary load on your database connection pool and scales linearly with your data, i.e., the more customers you have, the slower your app gets.
Without tracing, this usually manifests as “API is slow,” and you have to dig through logs to guess why. With tracing, the problem is undeniable.
Let’s hit the bad endpoint:
curl localhost:8080/orders-nplus1Now, check the trace in Jaeger:
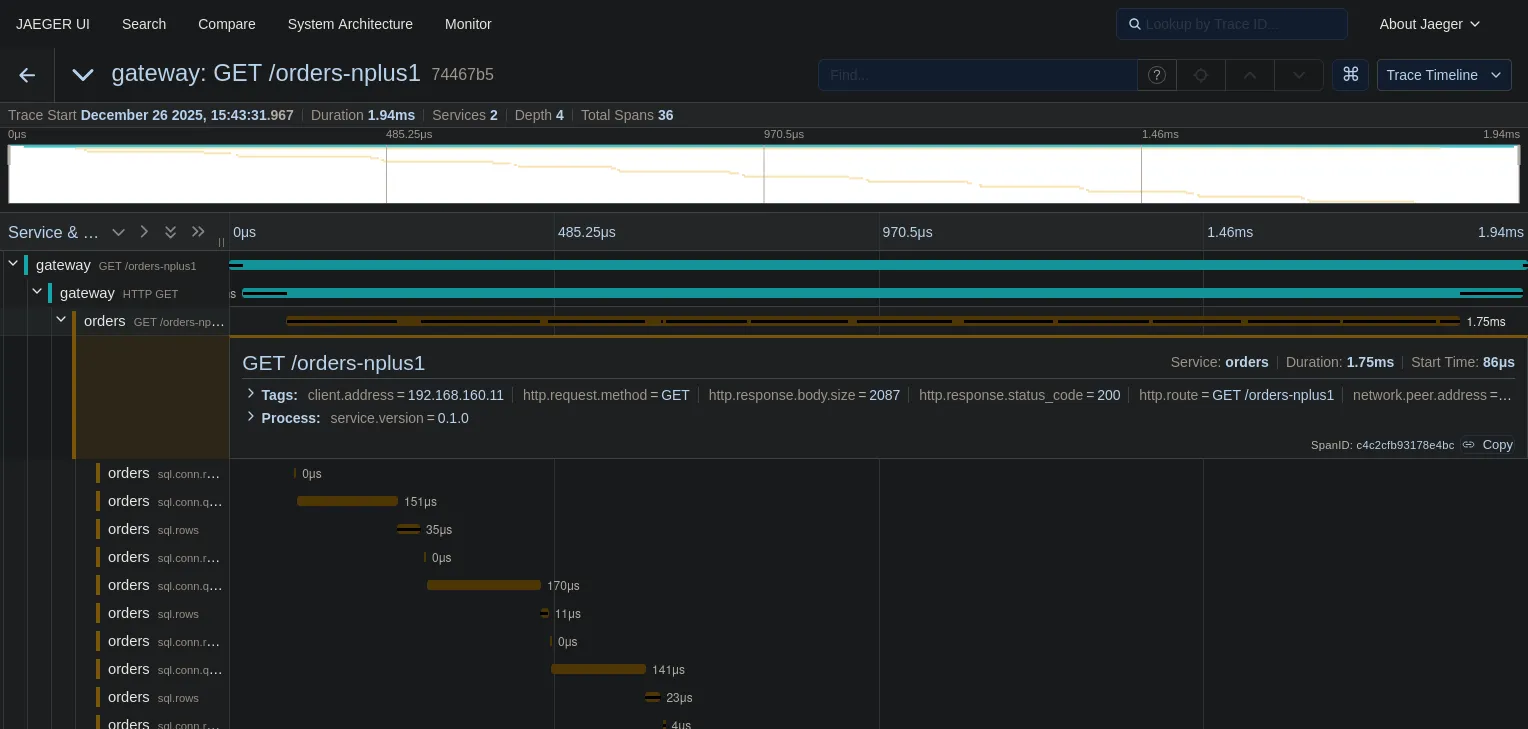
Look at that “staircase” pattern.
- The top teal bar is the HTTP request to the Gateway.
- The next bar is the call to the Orders service.
- The yellow bars underneath? Those are 36 sequential database queries.
We can see exactly what happened: we fetched a list of orders (the first long yellow bar), and then for every single order, we made a separate round-trip to the database to fetch items.
This visualization makes performance issues clear. You don’t need to be a DBA to see that this is wrong.
The Fix
Now let’s look at the efficient implementation. Instead of querying inside the loop, we fetch all orders, collect their IDs, and then fetch all items in a single batch query.
// 1. Fetch all ordersrows, _ := r.db.QueryContext(ctx, "SELECT ... FROM orders ...")// ... collect IDs ...
// 2. GOOD: Fetch all items in ONE queryitemRows, _ := r.db.QueryContext(ctx,    "SELECT ... FROM order_items WHERE order_id = ANY($1)",    pq.Array(orderIDs),)
Let’s hit the good endpoint:
curl localhost:8080/ordersAnd the trace is much cleaner:
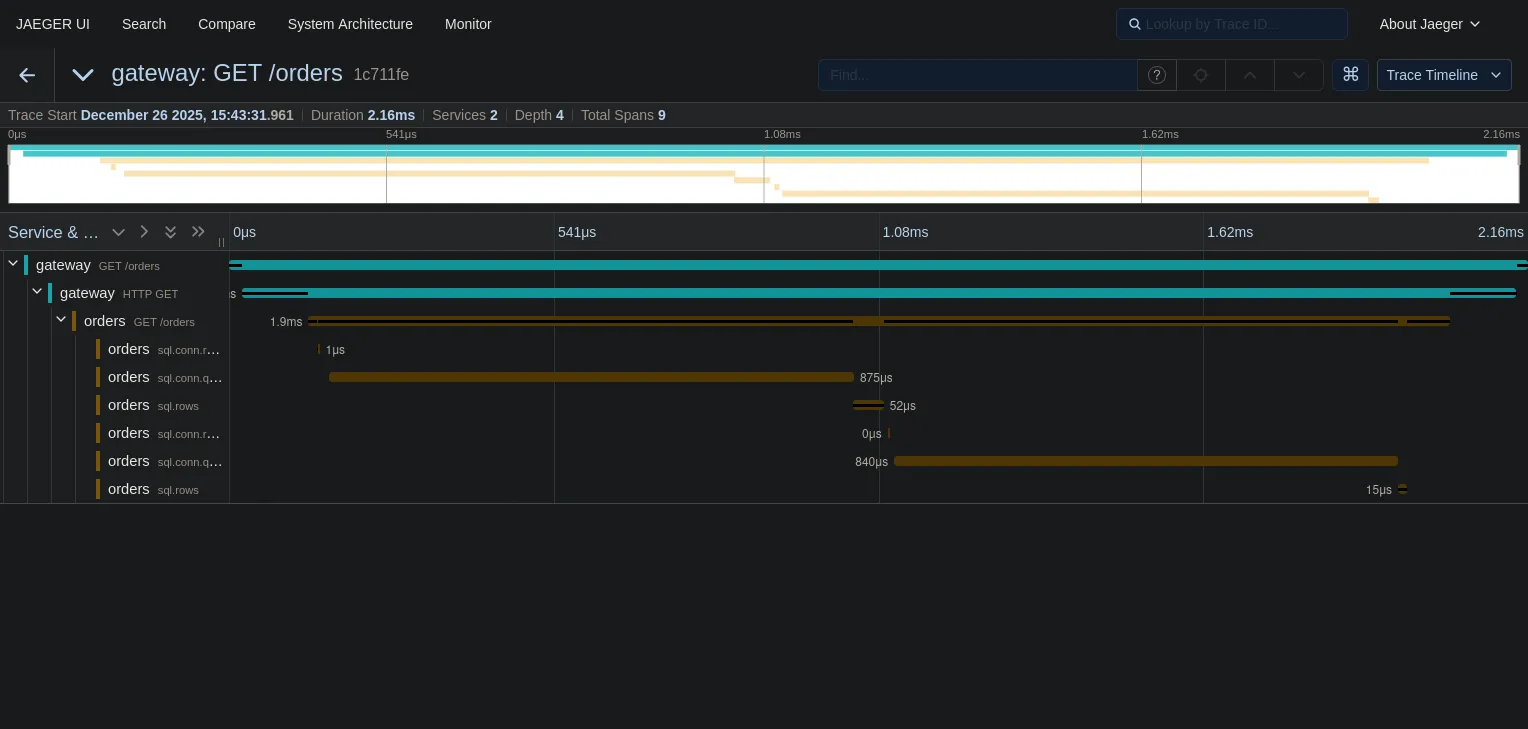
- Duration: In this tiny local example with zero network latency, the total
duration is roughly the same (~2ms). But don’t let that fool you. If there were
even 1ms of network latency between the app and the database, the N+1 approach
would instantly balloon, while the batch approach would stay at ~3ms. The N+1
pattern kills you at scale, not in
localhostdemos. - Spans: We went from 36, possibly more spans to just 2 database spans.
One final observation on these traces: notice that the SQL statements show
placeholders like $1 instead of actual values. Since we use parameterized
queries, user data (PII) is naturally redacted from our telemetry. This is a
double win: safe against SQL injection and safe for observability.
What’s Next?
We’ve covered the two most common request types: HTTP and Database. You can now trace a request from the user, through your gateway, into your service, and down to the metal of your database.
But our architecture diagram had another component: Kafka.
In modern systems, a lot of work happens asynchronously. An order is placed, and then a background worker sends an email. How do we trace that? How do we link the “Order Created” HTTP request to the “Send Email” background job?
In the next post, we’ll tackle Message Queue Instrumentation and learn how to propagate context across asynchronous boundaries.
See you there!
