# Anatomy of a Trace: Spans, Context, and the Glue That Connects Services
Table of Contents
Your trace shows a 500ms response time. The SLA is 200ms. Where did those 300 milliseconds go?
Was it the database? The downstream inventory check? A degraded downstream service? Before you can answer any of that, you need to understand what a trace actually is, and how the pieces fit together.
In the previous post, we established that distributed systems are hard to debug because requests scatter across services. Tracing stitches that fragmented history back together. But how? How does Service B know it’s part of the same request as Service A?
That’s what we’ll cover here: the three core concepts that make distributed tracing work, Spans, Context Propagation, and Semantic Conventions.
The Anatomy of a Trace
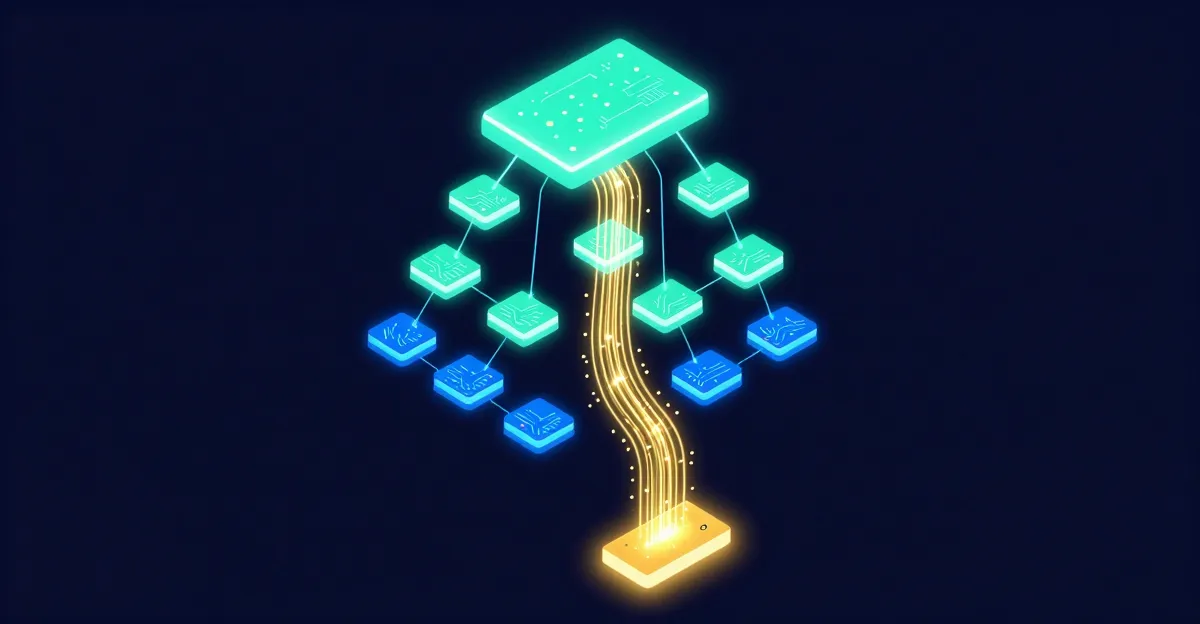
A trace is essentially a tree of spans. It represents the execution path of a single request as it propagates through a distributed system.
What is a Span?
A span represents a single unit of work. This could be a full HTTP request handler, a specific database query, or even a function call you want to measure.
Every span contains:
- Name: “GET /api/v1/orders” or “SELECT * FROM users”
- Context:
TraceID: Unique global identifier for the entire trace (16 bytes).SpanID: Unique identifier for this specific span (8 bytes).ParentSpanID: The ID of the span that called this one (unless it’s the root).
- Timestamps: Start and End time.
- Attributes: Key-value pairs providing context (
http.method=GET,user.id=123). - Events: Structured logs attached to the span (e.g., “acquired database connection”).
- Status: Did this work succeed or fail?
If you visualize it, it looks like a waterfall:
[ Client Request (Root Span) .................................. 200ms ] └── [ Auth Service Middleware ....................... 20ms ] └── [ Order Service Handler ......................... 150ms ] ├── [ Get User (DB Query) ....... 15ms ] ├── [ Validate Inventory (HTTP) ............. 100ms ] │ └── [ Inventory Service Handler ... 80ms ] │ └── [ Check Stock (Redis) ... 5ms ] └── [ Save Order (DB Transaction) ........... 25ms ]Notice the relationship: The “Inventory Service Handler” is a child of “Validate Inventory”, which is a child of “Order Service Handler”. This hierarchy is built using ParentSpanIDs.
Context Propagation
Now we know what a span looks like. But how does Service B know it’s part of the same trace as Service A? That’s where context propagation comes in.
When Service A calls Service B, it needs to tell Service B: “Hey, I’m working on Trace X, and my Span ID is Y.”
This process is called Context Propagation.
W3C Trace Context
In the past, every vendor had their own headers (x-b3-traceid,
uber-trace-id, etc.). OpenTelemetry standardized on the W3C Trace Context
specification.
The standard header is traceparent. It looks like this:
traceparent: 00-0af7651916cd43dd8448eb211c80319c-b7ad6b7169203331-01 │ │ │ │ │ │ │ └─ flags (sampled) │ │ └─ parent span ID │ └─ trace ID └─ versionWhen your Go application makes an HTTP request to another service, the OpenTelemetry SDK automatically injects this header. The receiving service extracts it and starts a new span using that Trace ID and Parent Span ID.
Baggage
There is a second header called baggage. While traceparent handles the
structural link, baggage allows you to propagate arbitrary key-value pairs
across the entire trace.
Example: You authenticate a user in the API Gateway. You can add user.id=123
to the baggage. Now, a service 4 hops down the line knows which user initiated
the request, without needing to query the user database itself.
Warning: Every byte in baggage is copied to every downstream request. A few small strings are fine; serializing objects is not.
Semantic Conventions
Context propagation gets spans connected. But how do we make them searchable?
If I name my HTTP method attribute http.method and you name yours
method.http, our analysis tools won’t recognize them as the same thing. You
can’t query “all GET requests” across services when everyone invents their own
attribute names. Worse, you’ll end up with dashboards that can’t correlate data
and on-call engineers grepping for five different attribute names at 3 AM.
Semantic Conventions are the agreed-upon standard names for common operations. OpenTelemetry defines these strictly.
Some common examples:
- HTTP:
http.request.method(GET, POST),http.response.status_code,http.route(the matched route template like/users/:id),url.full - Database:
db.system.name(postgresql, mysql),db.namespace(database name),db.query.text(the parameterized query, e.g.,SELECT * FROM users WHERE id = $1) - RPC:
rpc.system(grpc, jsonrpc),rpc.service,rpc.method - Messaging:
messaging.system(kafka, rabbitmq),messaging.destination.name(topic or queue name),messaging.operation.type(send, receive, process) - Exceptions:
exception.type,exception.message,exception.stacktrace
When we use the official OpenTelemetry Go libraries in the next posts, these attributes are populated automatically. If you write manual instrumentation, you should stick to these conventions to ensure your data plays nicely with backends like Jaeger or Grafana Tempo.
Putting It Together
Let’s trace a single order request through the system:
- A request hits your API Gateway. The SDK creates a root span with a fresh Trace ID.
- The gateway authenticates the user and calls the Order Service. Before the
HTTP request leaves, the SDK injects the
traceparentheader. - The Order Service extracts that header and creates a child span, same Trace ID, new Span ID, with the gateway’s Span ID as its parent.
- The Order Service queries the database. Another child span is created,
enriched with
db.system.name=postgresqlanddb.query.text. - The request completes. All spans are exported to your tracing backend, stitched together by their shared Trace ID.
When you open Jaeger, you see the full waterfall: every service, every database call, every millisecond accounted for.
A Note on Sampling
In production, you won’t trace every single request, the storage and network costs would be brutal. Sampling strategies let you capture a representative subset: maybe 1% of normal traffic, but 100% of errors. We’ll cover sampling in depth in a later post; for now, just know it exists.
Next Up
Enough theory. In the next post, we’ll initialize the OpenTelemetry SDK in a Go application, configure a trace provider, and watch our first trace light up in Jaeger. You’ll finally see what all these concepts look like in practice.
